Trade Journal
Market Gear Trade Journal Module
Successful traders analyze their results, but most platforms don’t offer the tools necessary to do this well. Outside tools that cost anywhere from $50 to $400 a month offer reporting and analytics that amount to a spreadsheet. Market Gear allows you to do this faster, better, and visually.
Auto-Journal
Trade first, worry about the journal later. Our system automatically recognizes what type of trade you are placing, from #longstock to #ironcondor and automatically tags each trade when it is executed so you don't have to.
Add Your Own Hashtag
Add more hashtags of your own choosing to a trade whenever you want. Your journal is saved forever. If you decide that certain trades have something in common, add your own hashtags to be able to sort results in a way that makes sense for you.
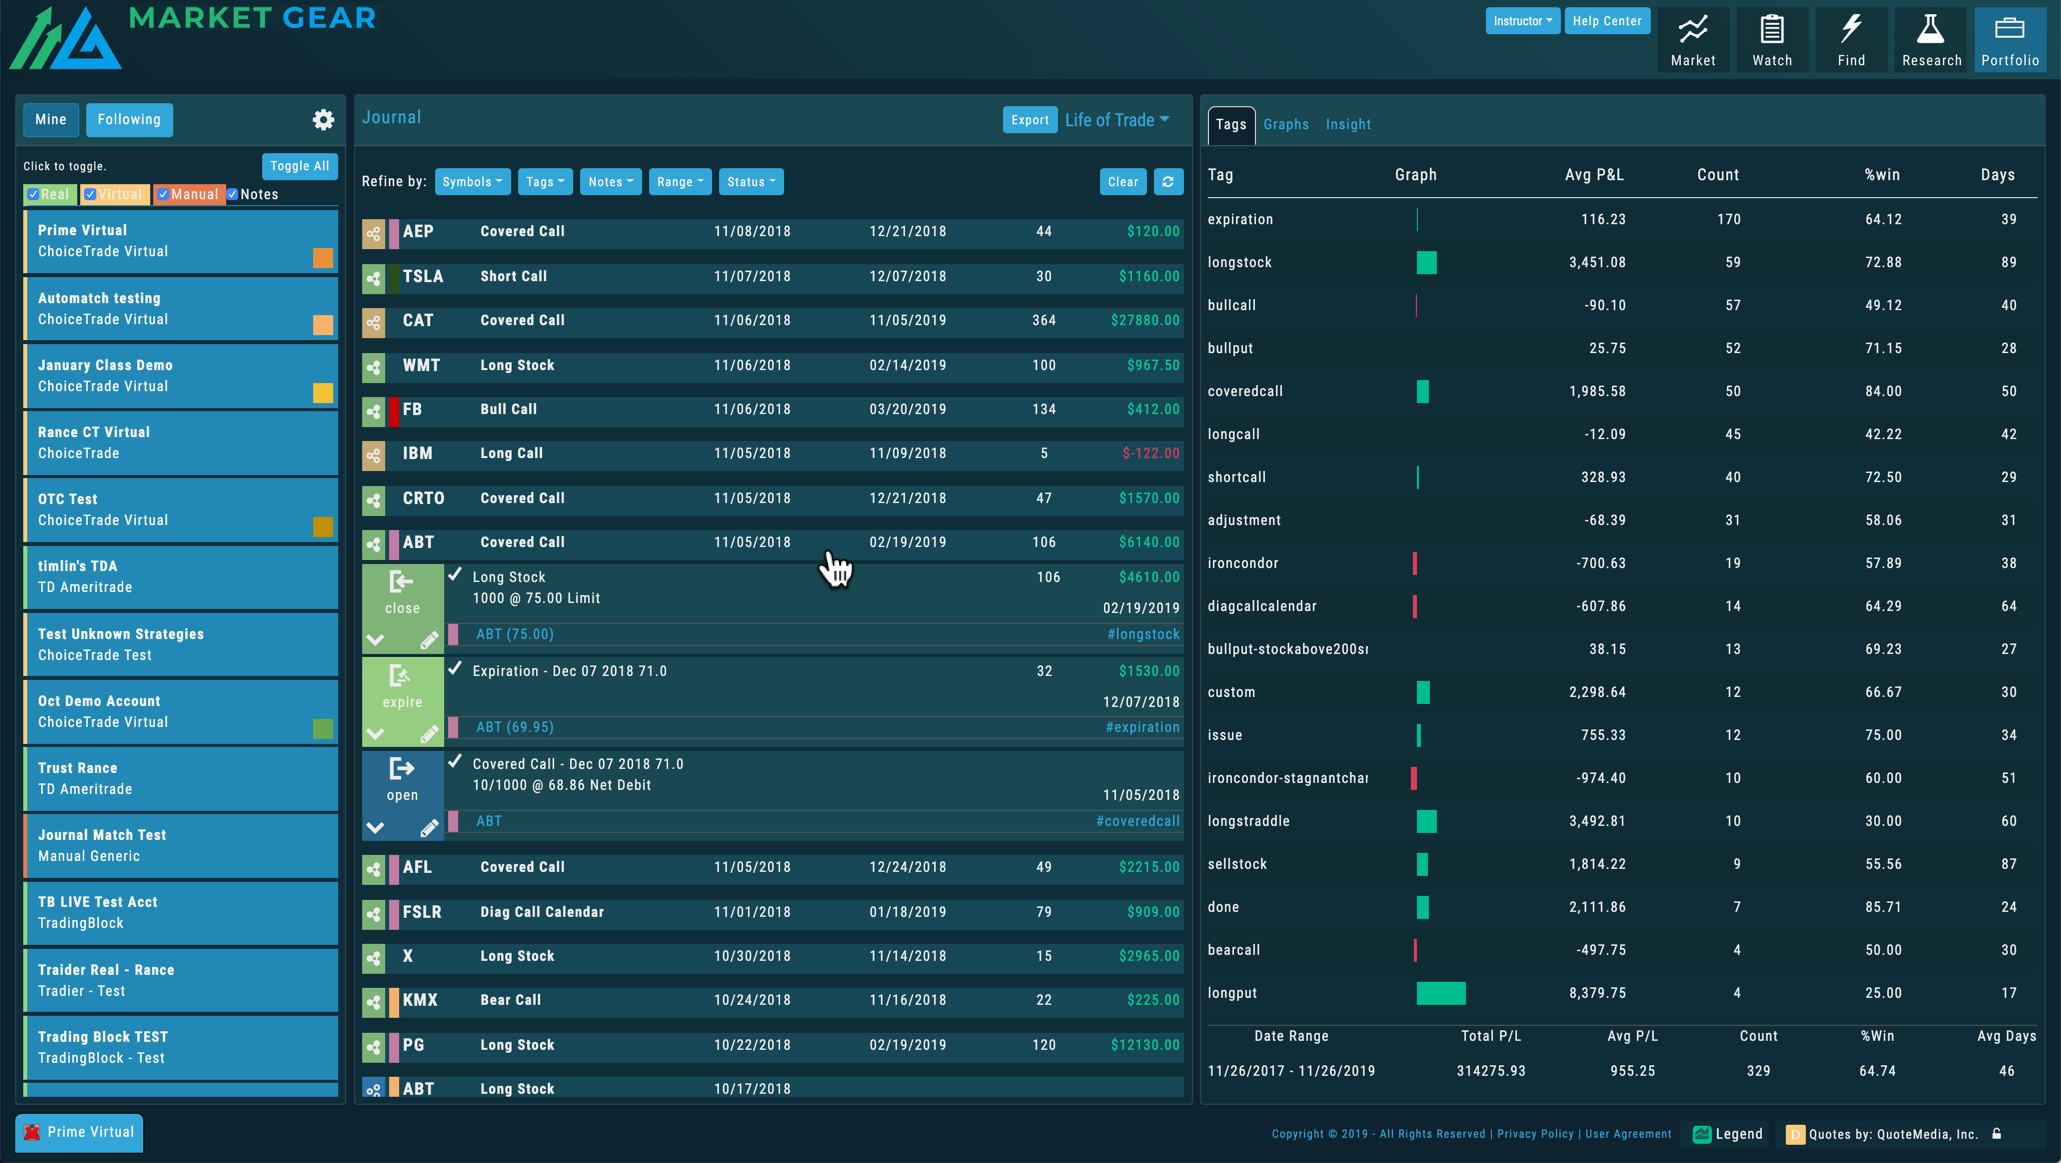
Deep Analytics
Review your trades however you want. Market Gear's reporting is extremely flexible and makes it very easy to drill down into specific types of trades and see your profitability results however you want to look at it. You won't find a more powerful journal for traders out there.
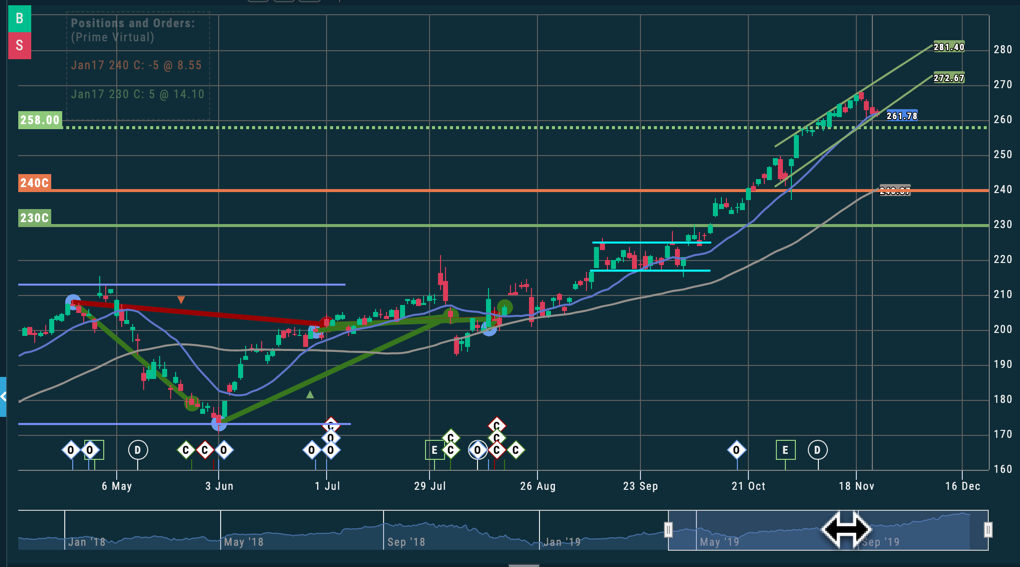
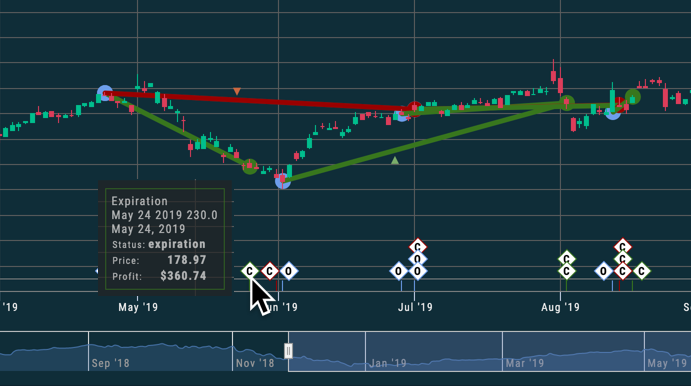
View Your History on the Charts
See the results on the charts! Our journal is not just about spreadsheet reporting. You can see your past trades visually and hover over the trades to see the gains and losses. There is a power to seeing your results over time.
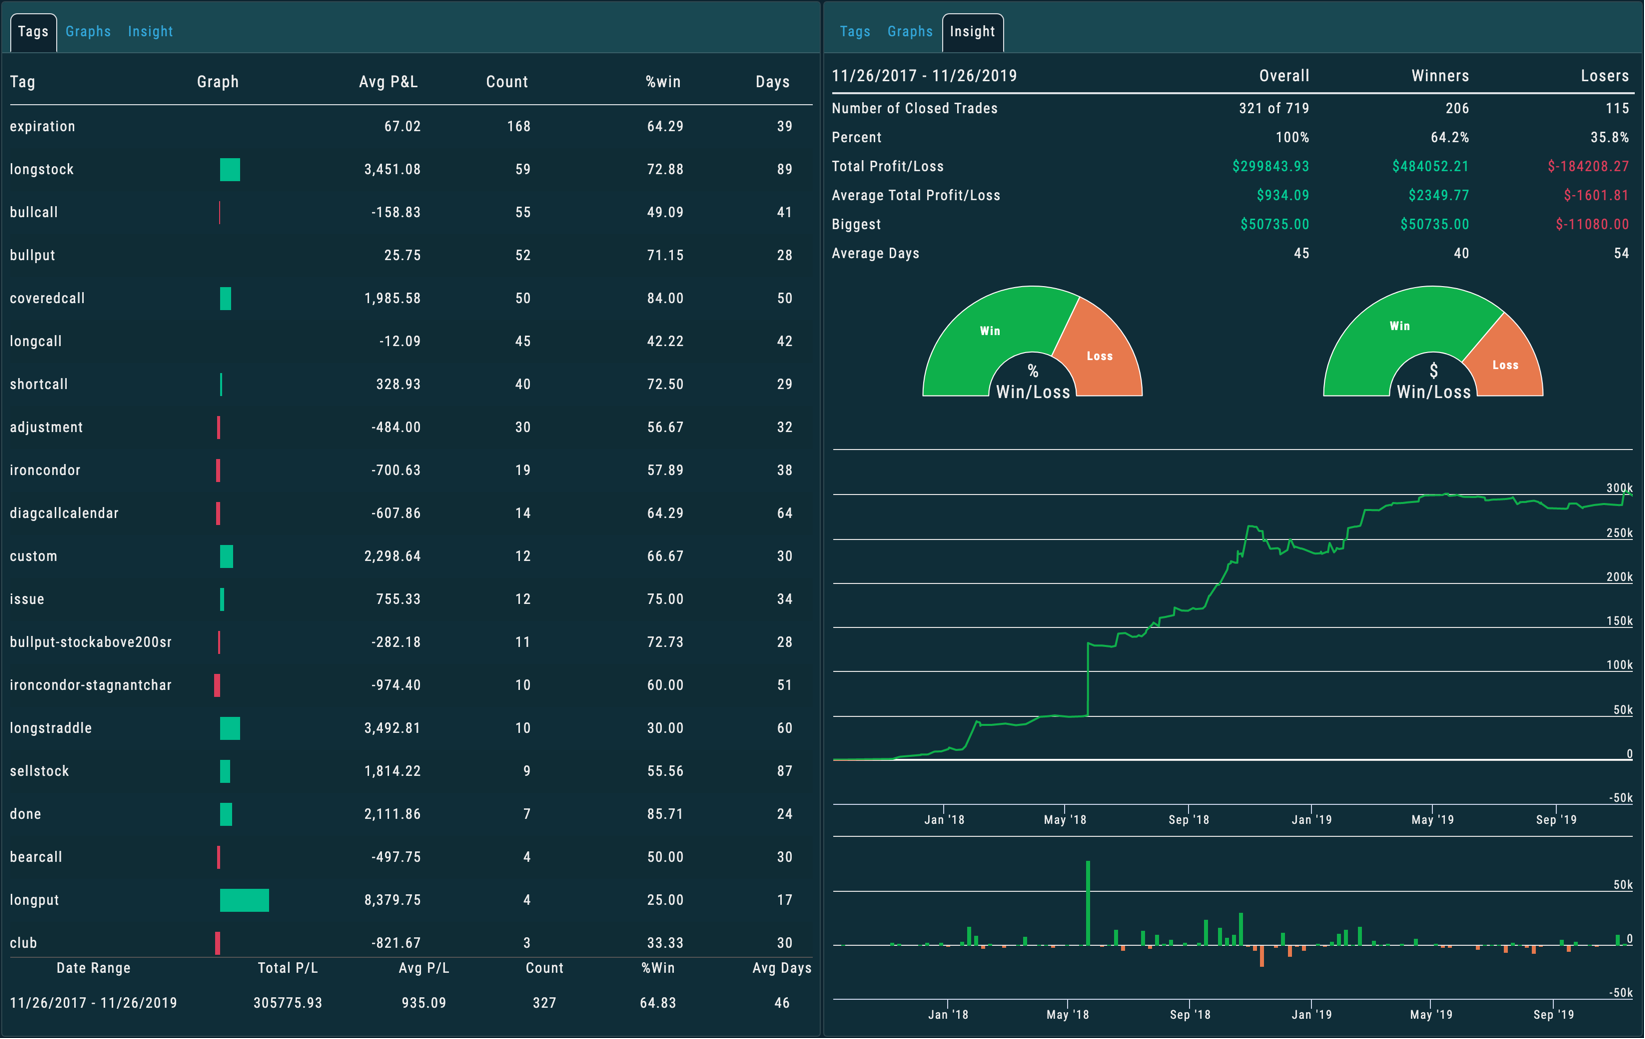
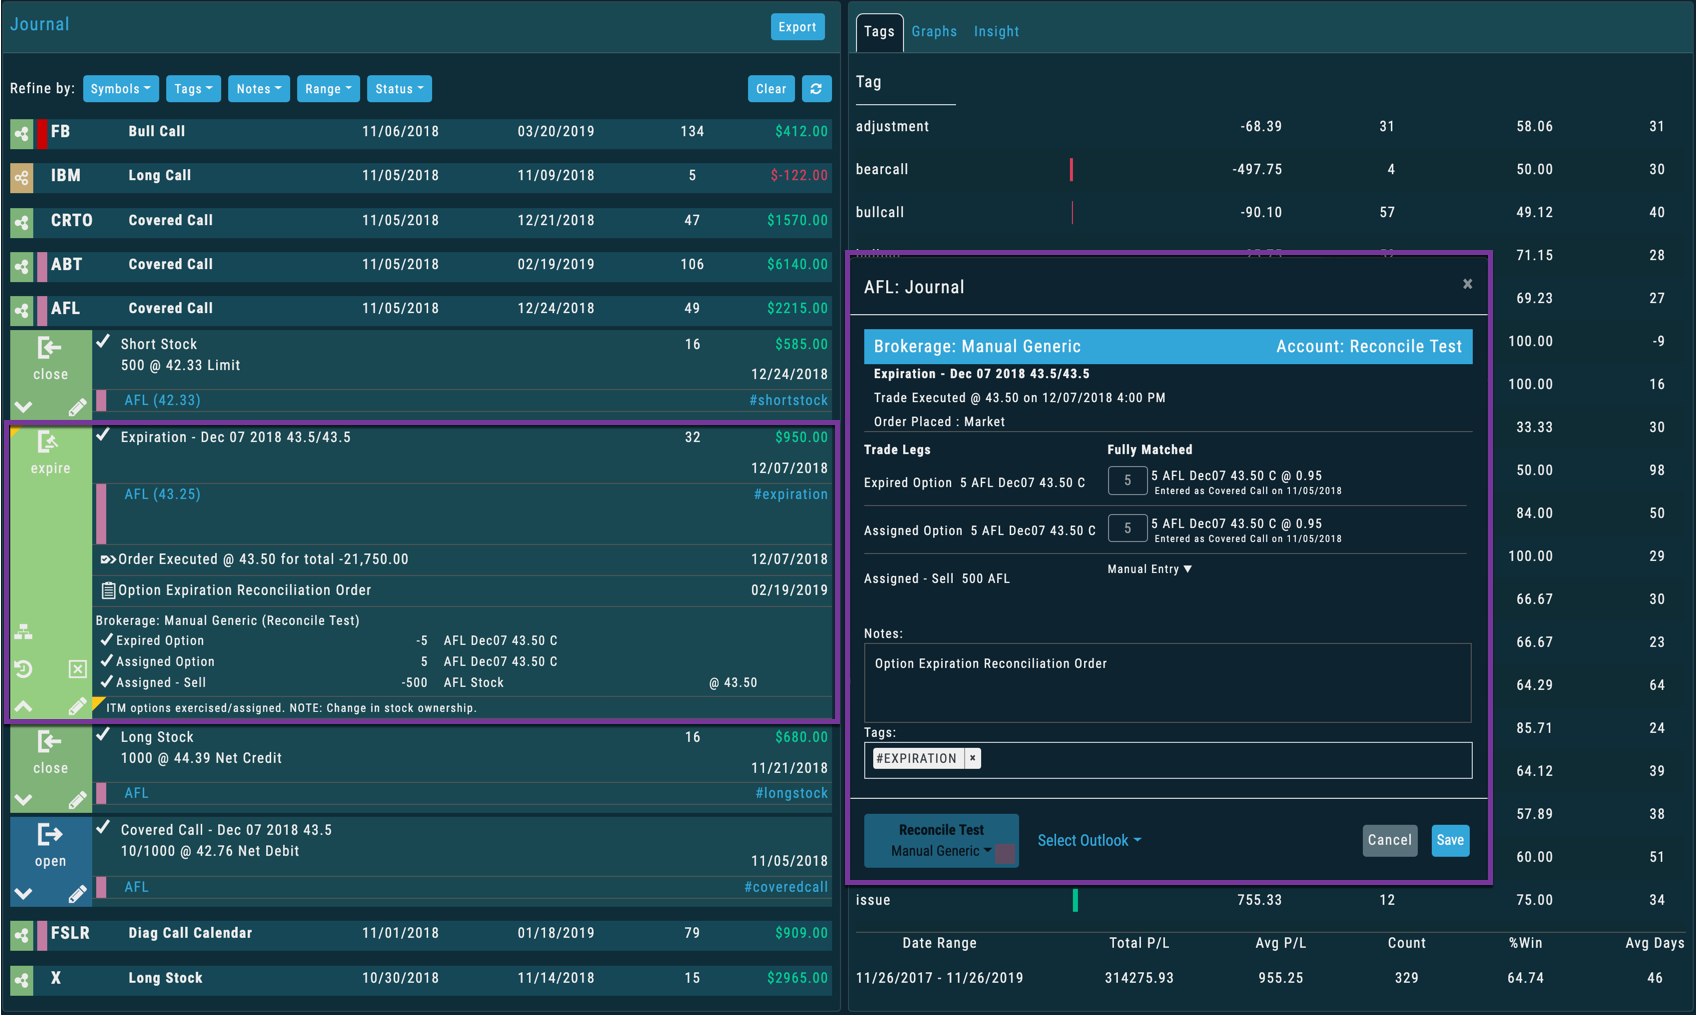
Click to Know
Click on anything in the journal to dive deeper into the numbers driving that data. You can get down to the individual trade level, focus on your overall results, or see which trade types have made you the most over time.
Central
Market Gear Trade Central Module
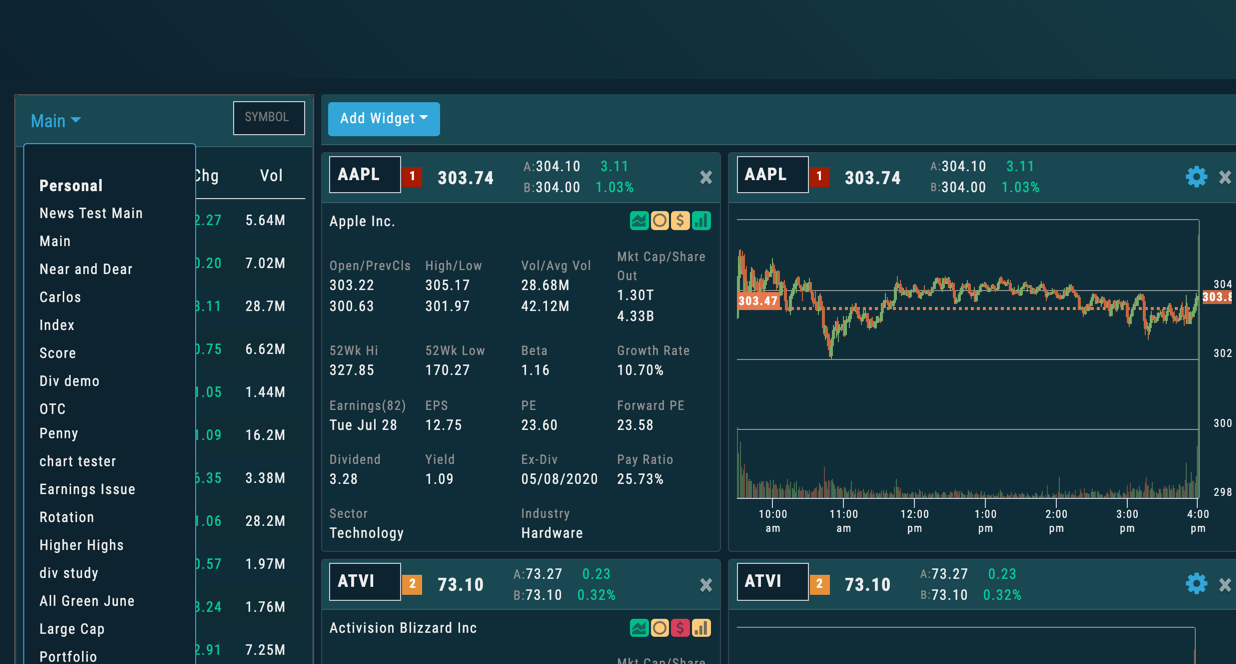
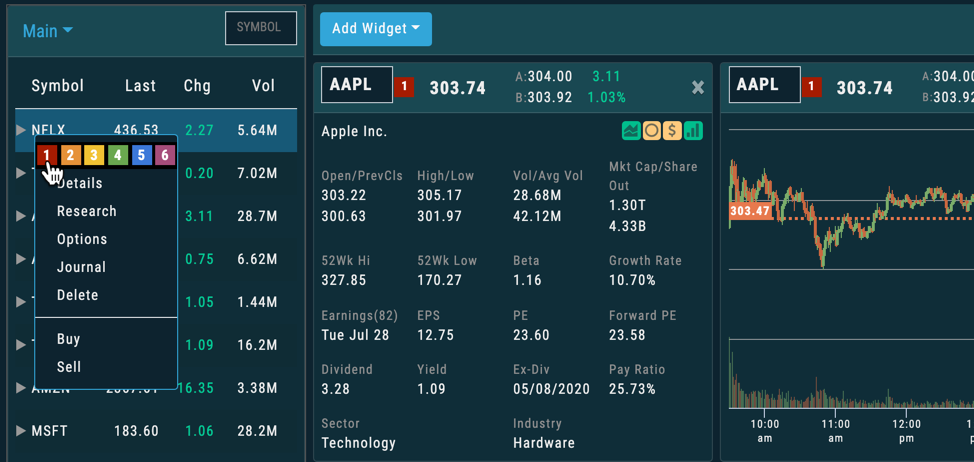
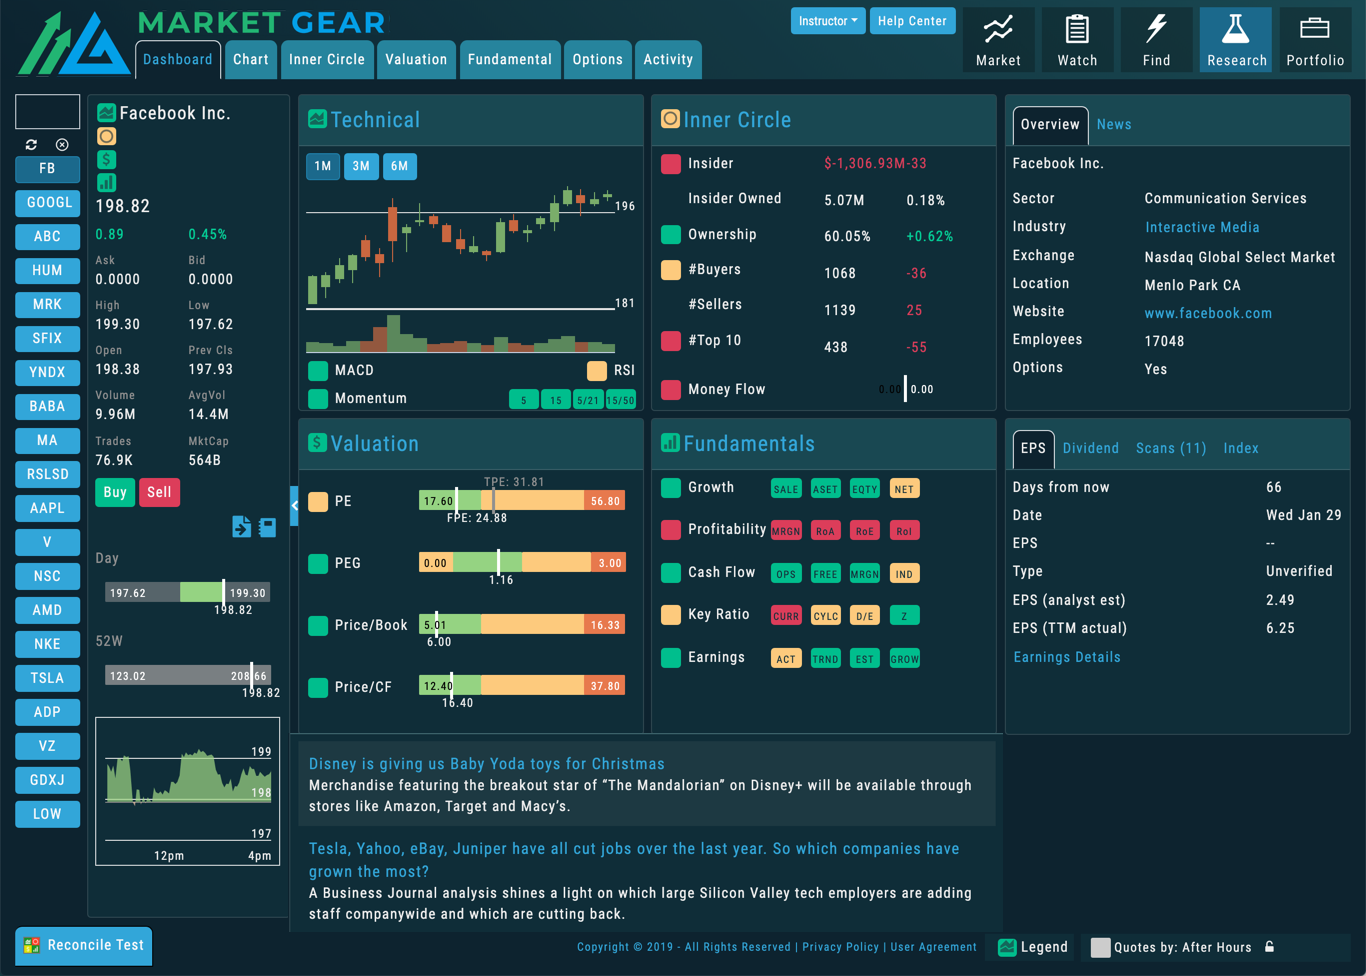
With Market Gear, you can customize your homepage so that the information you care about most is always the first thing you see. Choose your Watchlist and then select from charts, quotes, and news pods to view the markets your way. We call it Market Gear Central. Select the type of chart and periodicity with ease and link the charts to your Watchlist to easily switch symbols.
Watchlists for the Modern World
Create as many Watchlists, including scan results, as you want and switch between them with ease to view the stocks you want while also being able to quickly click and change the charts.
Charts...Linked or Free
Assign a chart to an area of Market Gear Central and decide if the symbol is sticky or linked to a watchlist, so you can either focus on one thing or flip through the stocks you want.
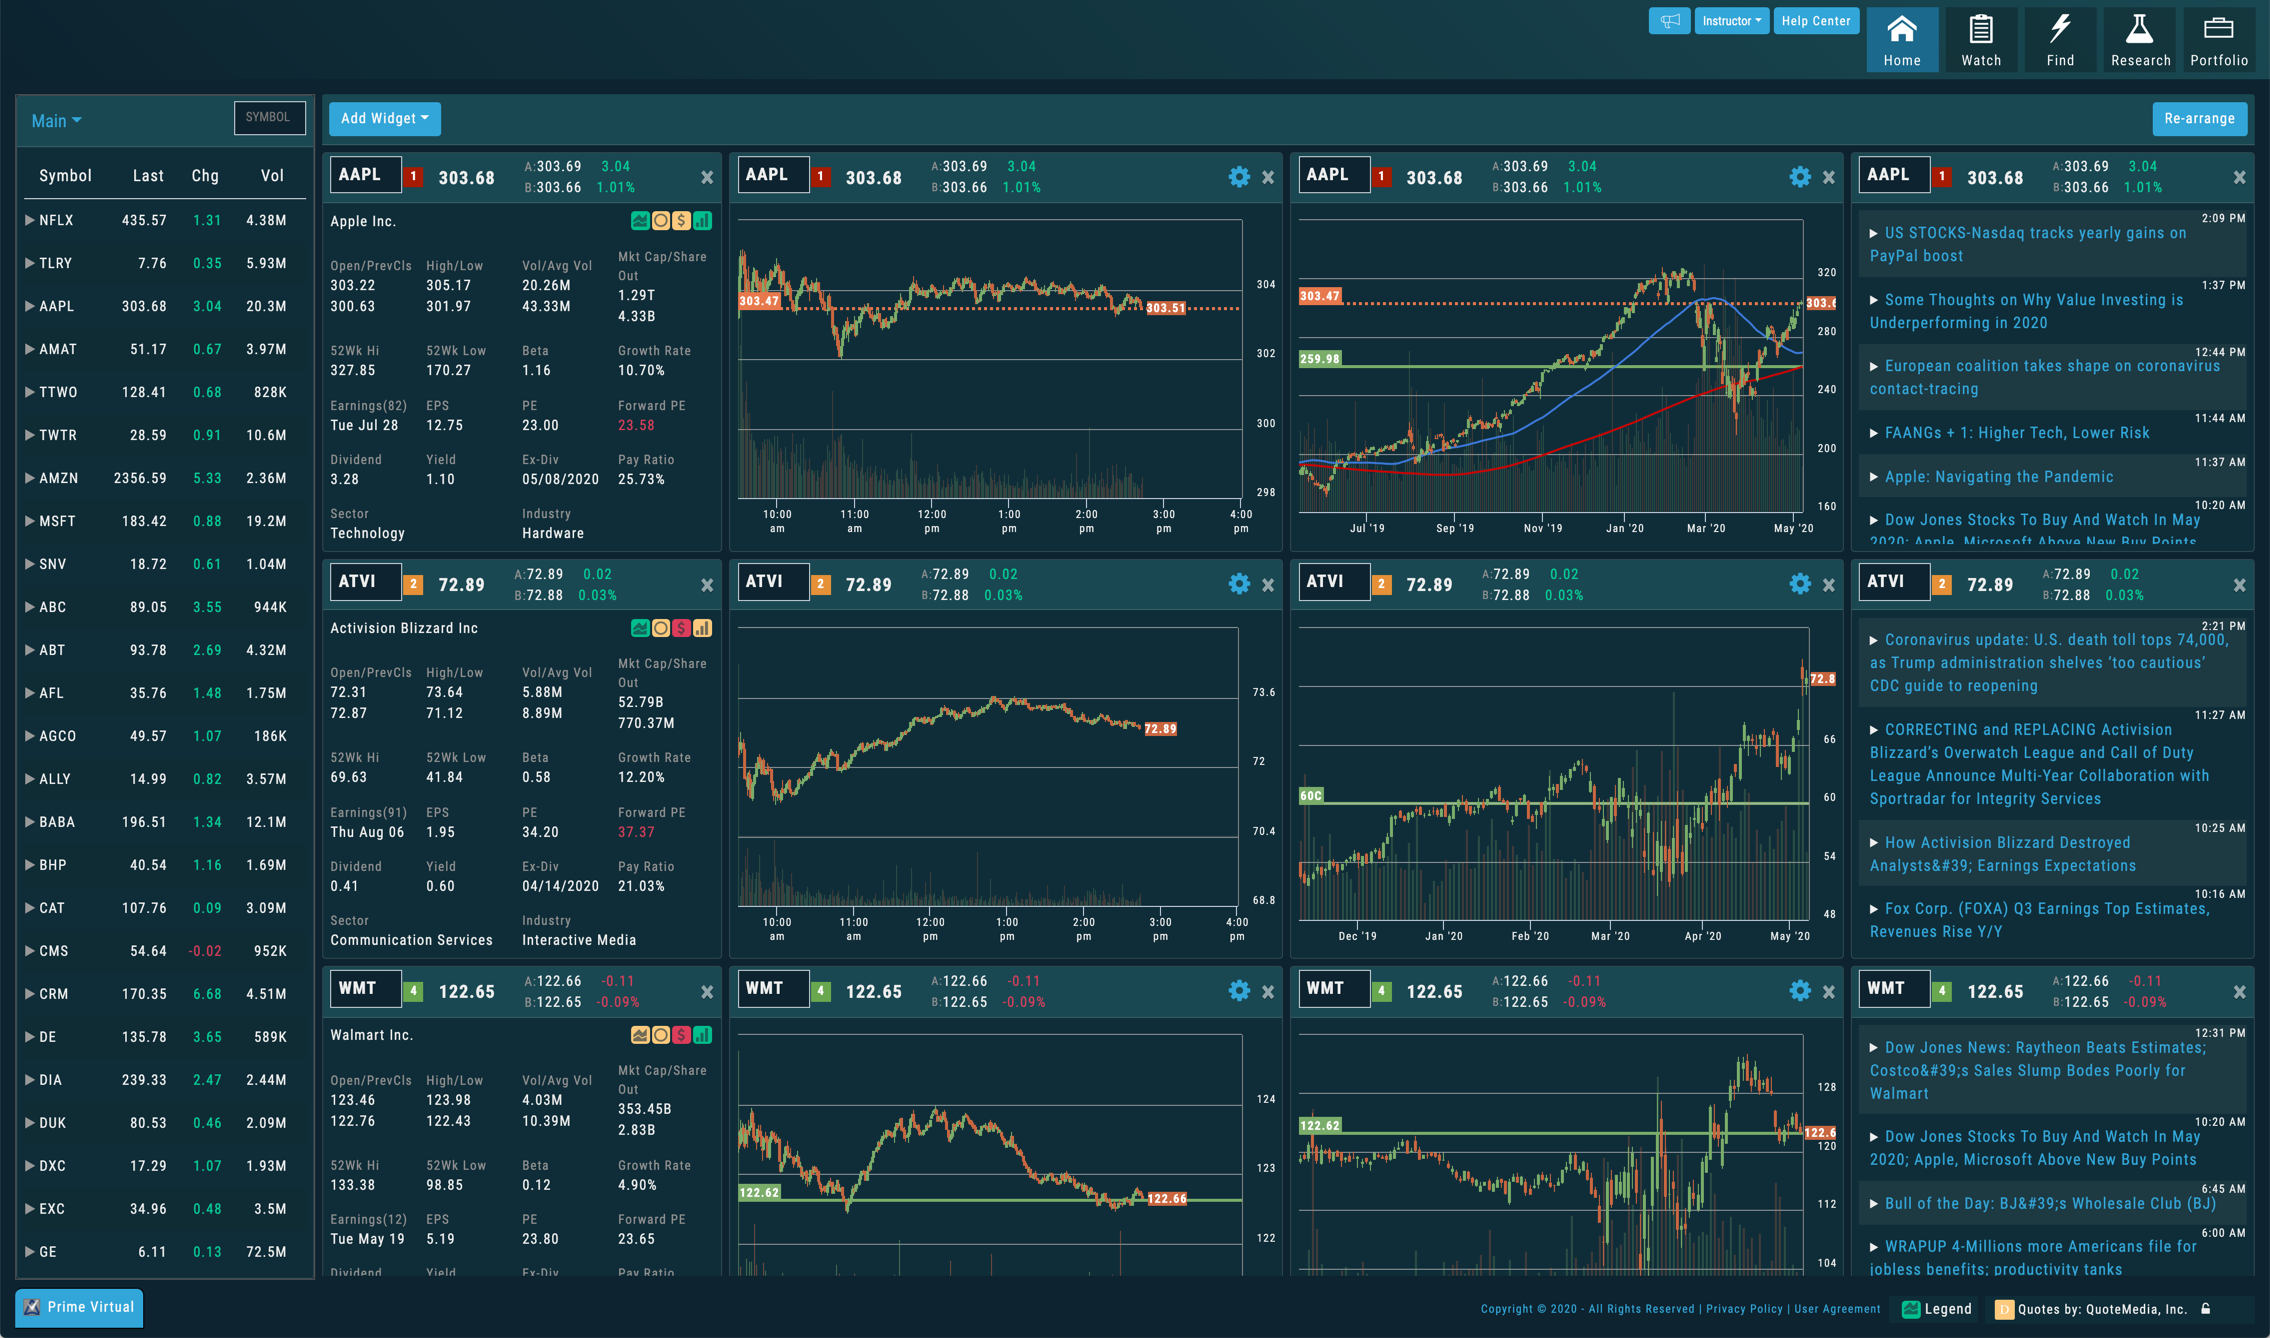
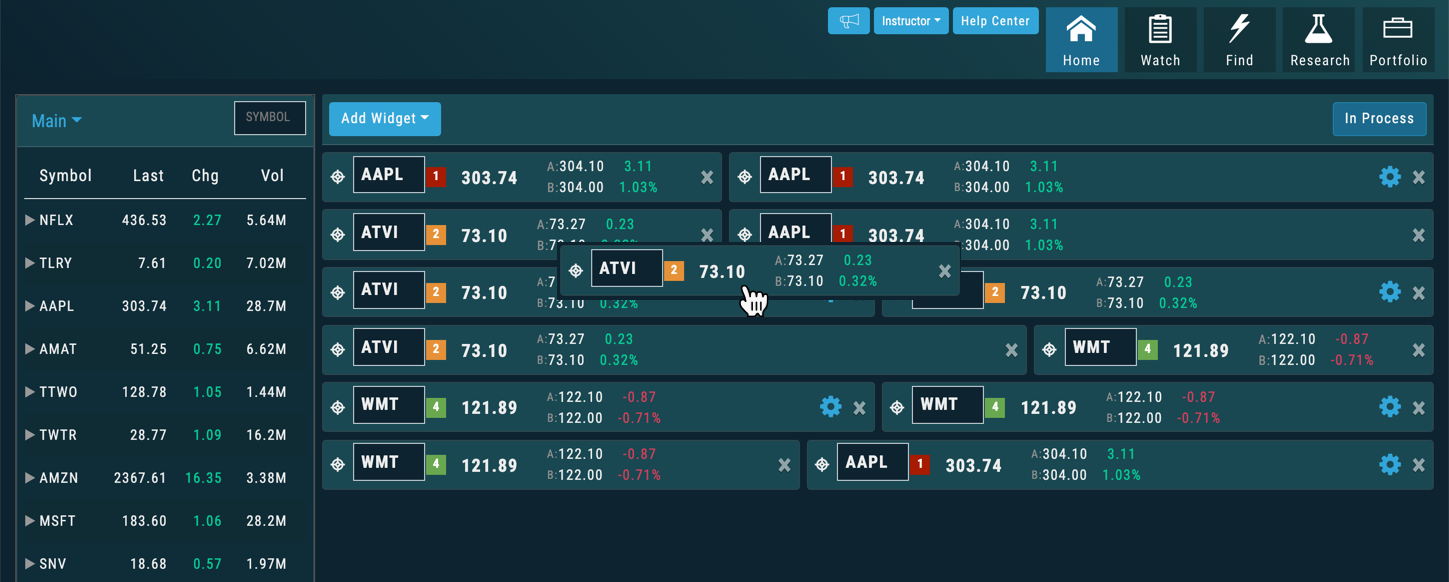
Rearrange with Ease
Add the pods you want and then hit the Rearrange button to drag them into the order that you want. The system remembers what you selected for the next time you log in so your layout will always be what you want.
Link Your Widgets
Choose which charts, news, and quote boxes change when you select a stock from your Watchlist. Want to see a daily and 5-minute chart of the same stock when you select it? No problem. You can link up to 100 charts.
Your Favorite Scan
Make your Watchlist show the results of your favorite scan directly on Market Gear Central. Stocks that meet your criteria will update in real-time throughout the day so you are never left without a trading idea.
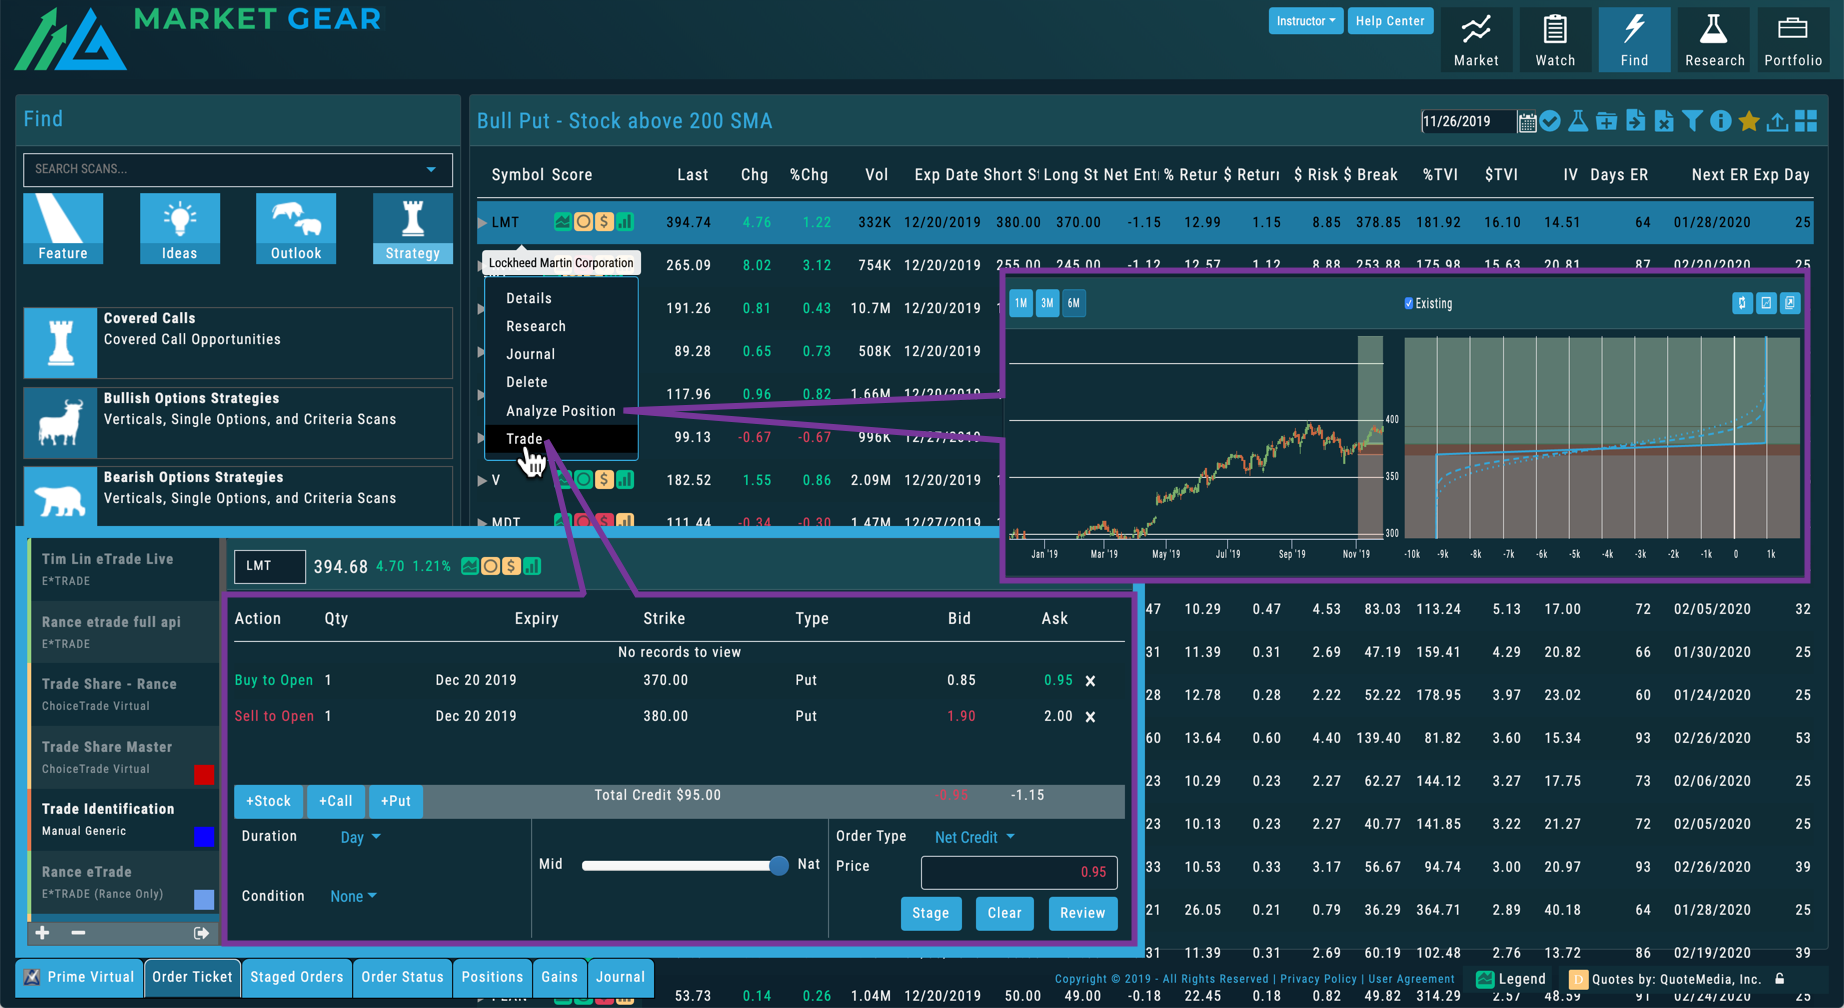
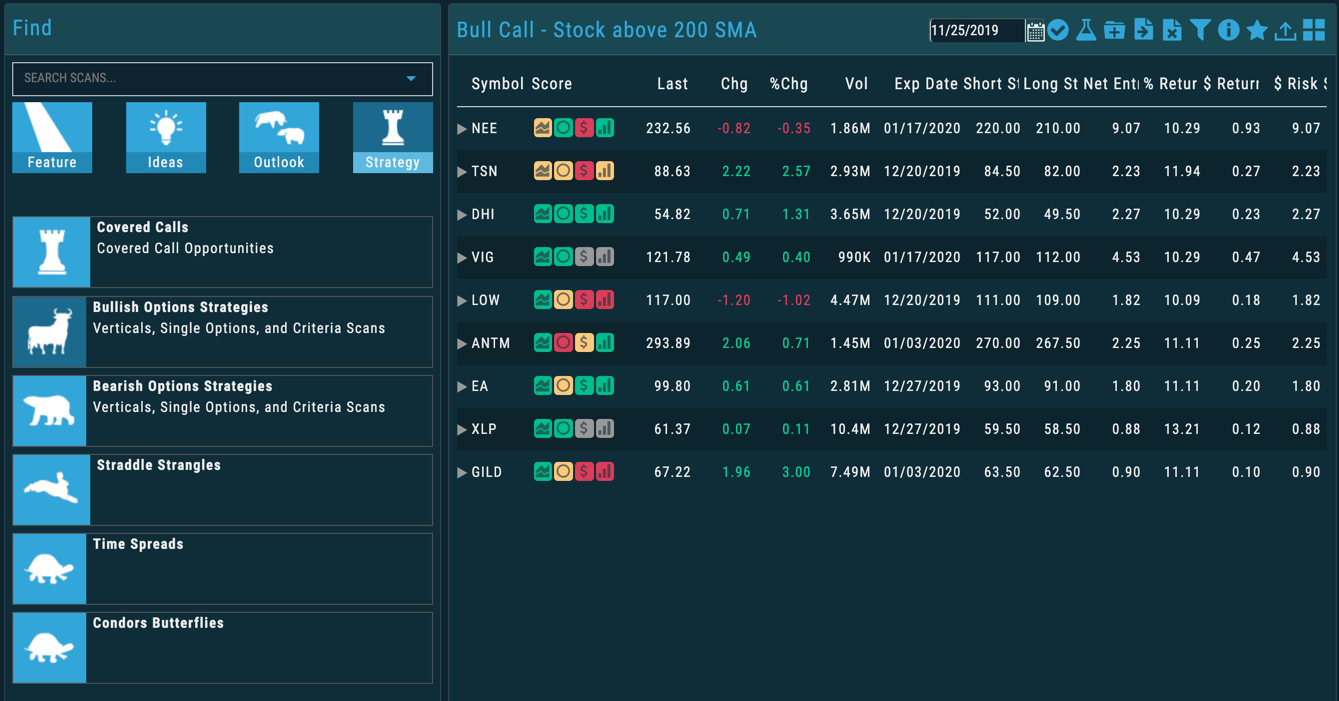
Scanner
Market Gear Scanner Module
Most traders need actionable trading ideas to put their money to work. Market Gears pre-defined scanners have hundreds of data points that can be used to find the right stock and options plays.
Technicals...
Sort through over 100 customizable technical indicators and scan the markets for the criteria that you want. Write as many scans as you want and set your favorites for quick access.
...and Fundamentals
Pick from an array of fundamental data, including financials, insider trading, institutional money flows, and much more for a deeper range of options than most other products offer.
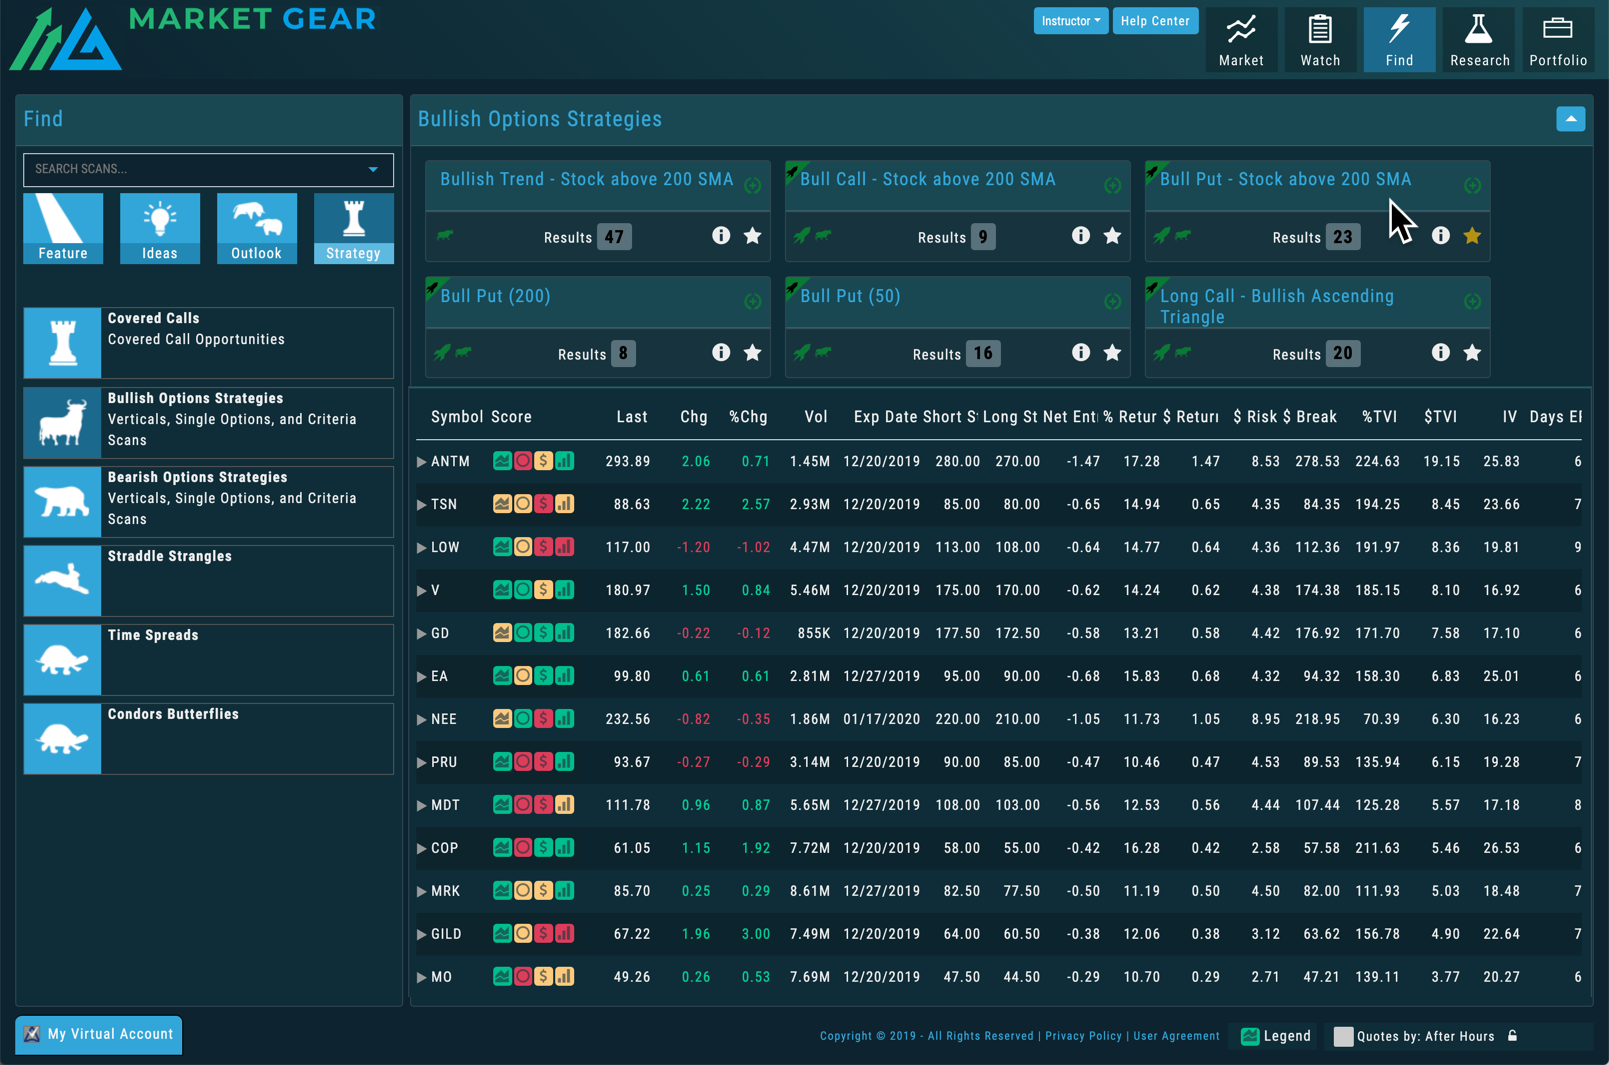
Click to Trade
Move directly from your scans to a stock trade ticket or options strategy template. Market Gear makes it simple to take an idea and turn it into a trade.
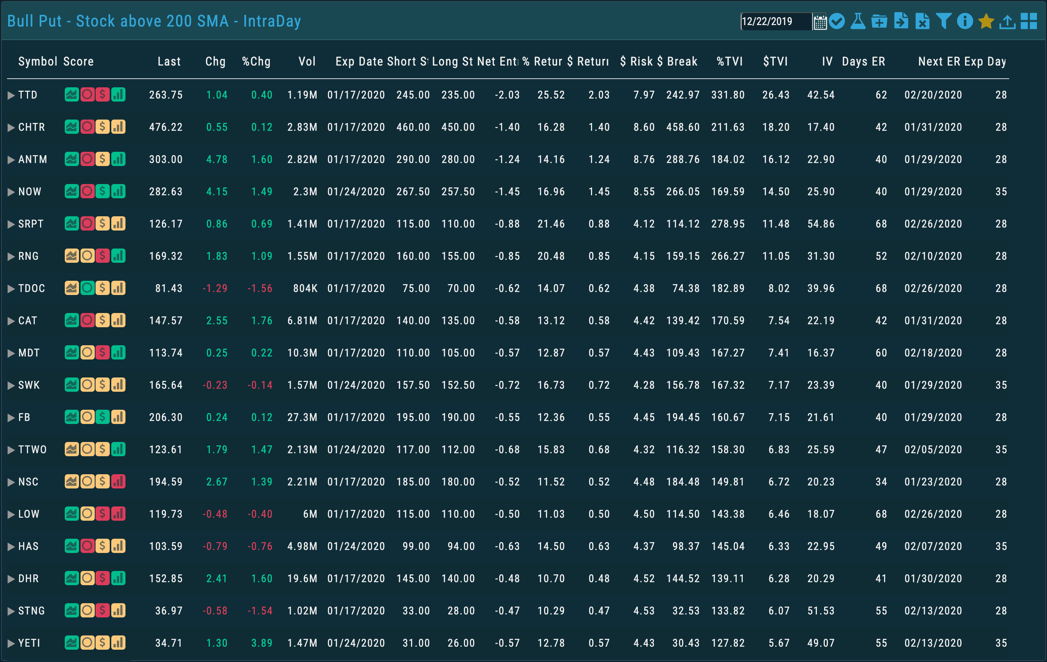
Save for Later
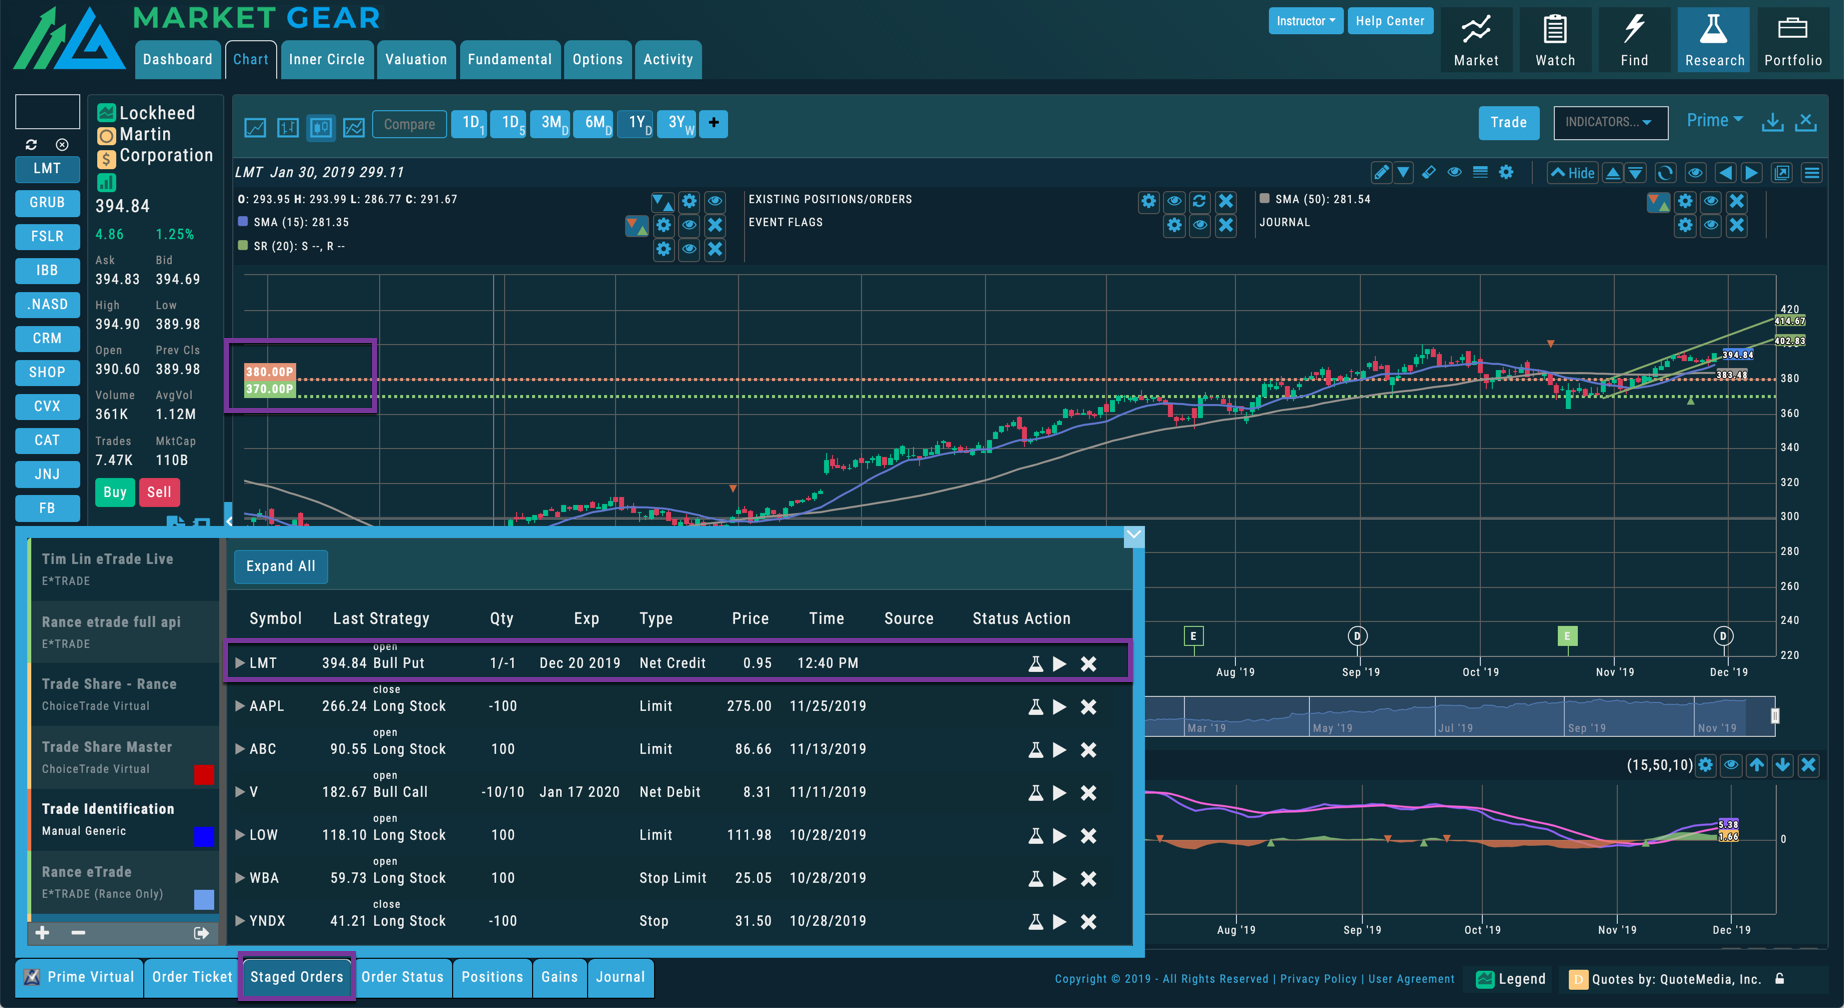
Stage your trade for later, which keeps the pricing and parameters ready to execute when you want to. You can even view the potential trade on your real-time charts.
Real-Time Options Scanner
Use the unrivaled power of Market Gear's new options scanner to find multi-leg options trades intraday. Our scanners can search the entire market of options for credit and debit spreads that you are looking for.
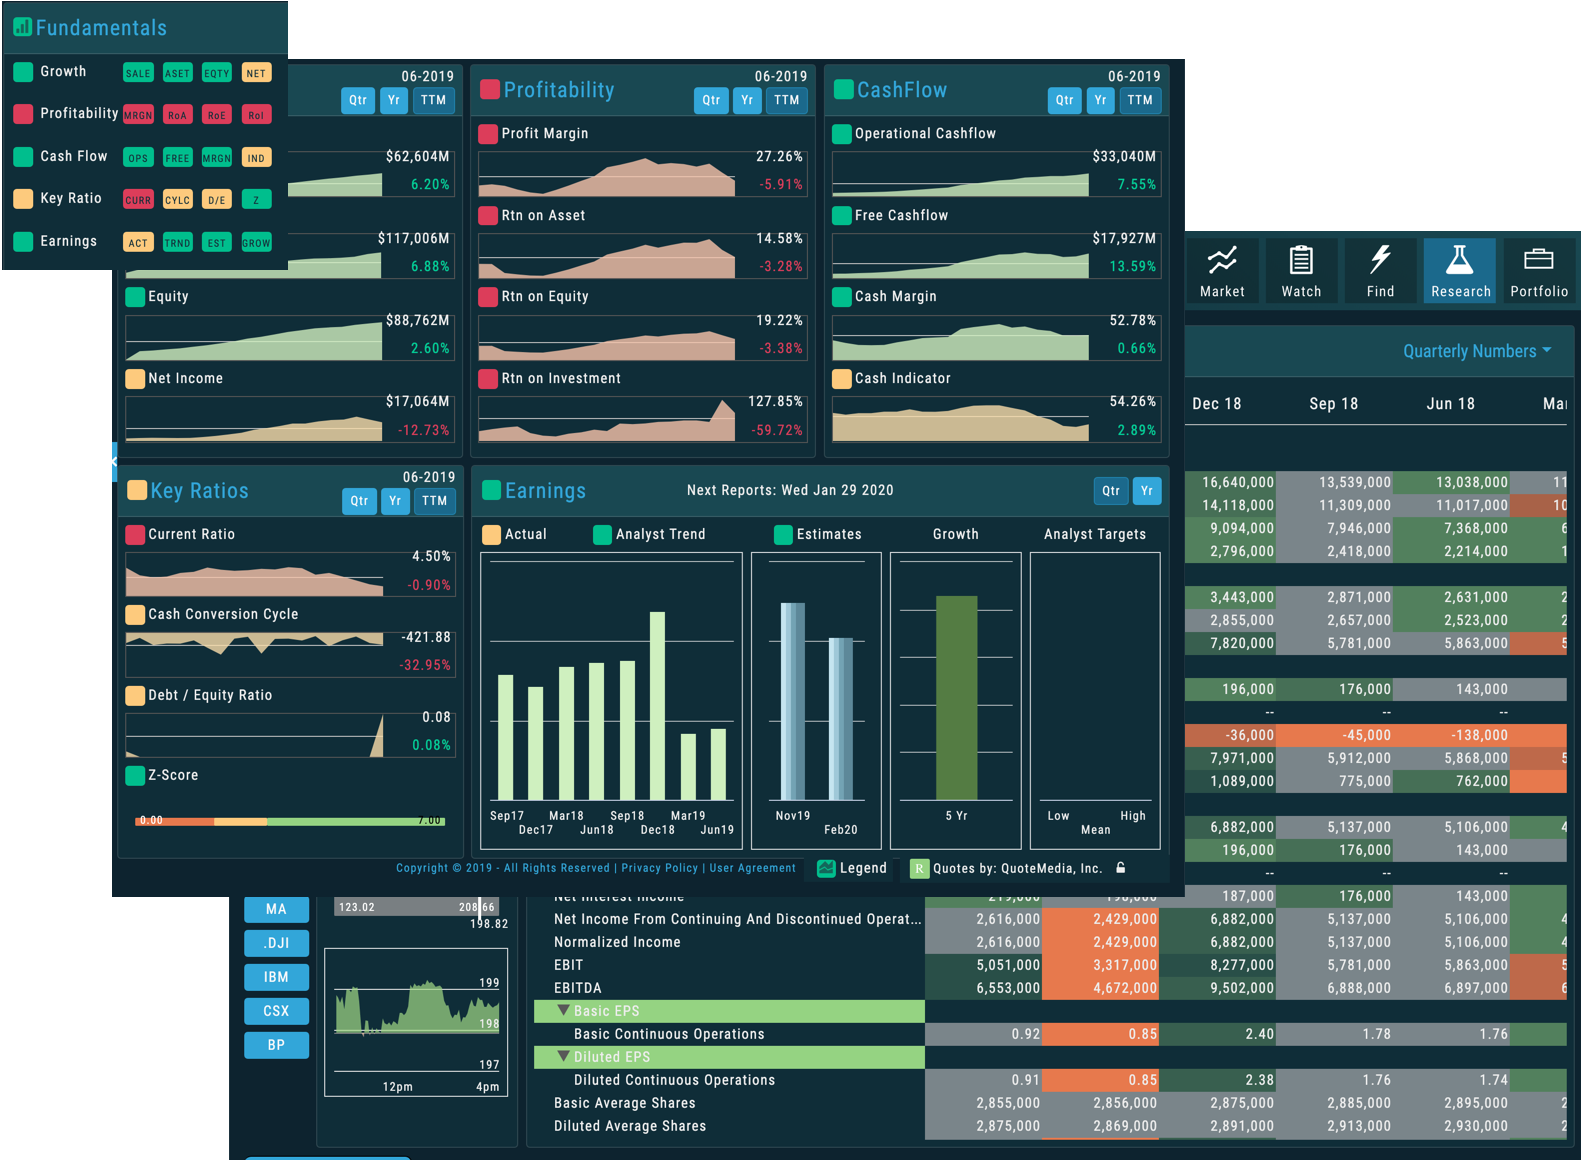
Research
Market Gear Research Module
Market Gear makes research fast and easy. We offer cross-tabulated fundamental data from earnings to cash flow to insider trading to institutional ownership, and you can dig as deep as you want with just a few clicks.
Just the Facts
Sort through numerous data points about money flow, balance sheets, ratios, and everything you need to understand a company's fundamental status before you make an investment.
Fast and Visual
Learn everything you want to know about the company you are looking at investing in at some of the fastest speeds in the industry as the platform delivers results on the fly.
Institutions and Insiders
Need to know what insiders are doing with their shares? Curious how funds and institutions are behaving with theirs? Market Gear knows.
Actionable Data
Find the most fundamentally stable companies with the biggest earnings, revenue growth, and projections, and figure out investment strategies to optimize your returns on those companies.
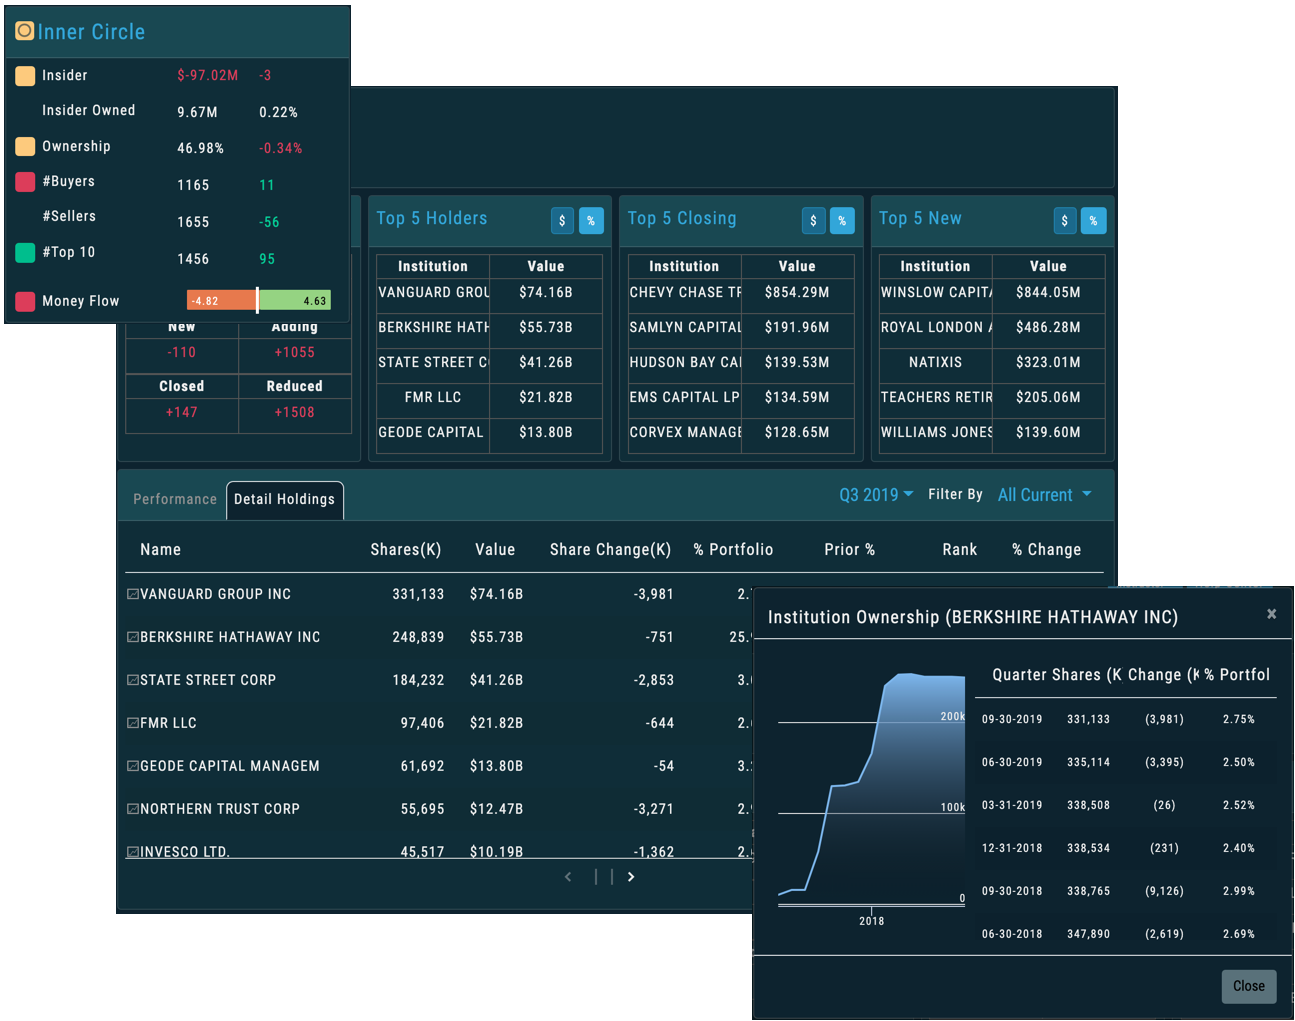
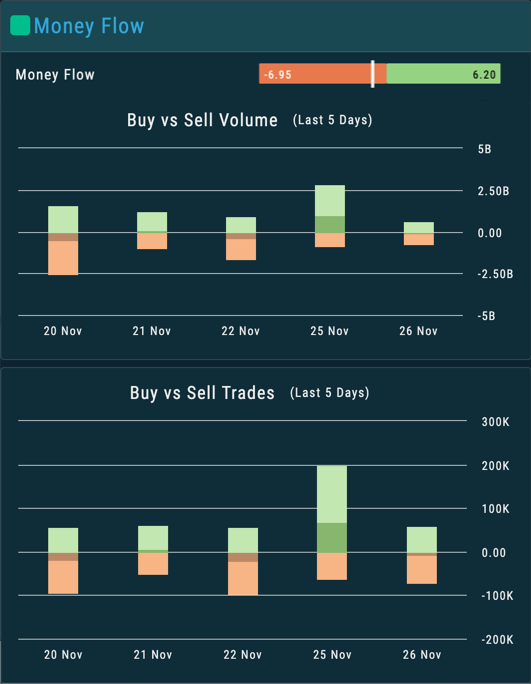
Money Flows
Learn which funds and institutions are buying your favorite stocks, and then cross-reference those funds to see what other investments they are making.
Options
Market Gear Options Module
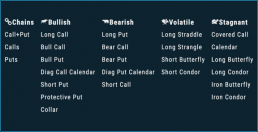
Our options module makes even the most complex options strategies visually easy to understand. We have templates that allow you to stay focused on a single strategy, but also allow you to switch between over 20 set options strategies such as Iron Condors and Bull/Bear Spreads.
Basic Options Chain
View the main options chain to sort through the various options pricing you are looking for and consider different strike prices and expirations with ease.
Trade from the Chain or Not
Use the visual ease of our options module to trade directly from the chain, or click to open a standard order ticket if you want to look at things differently.
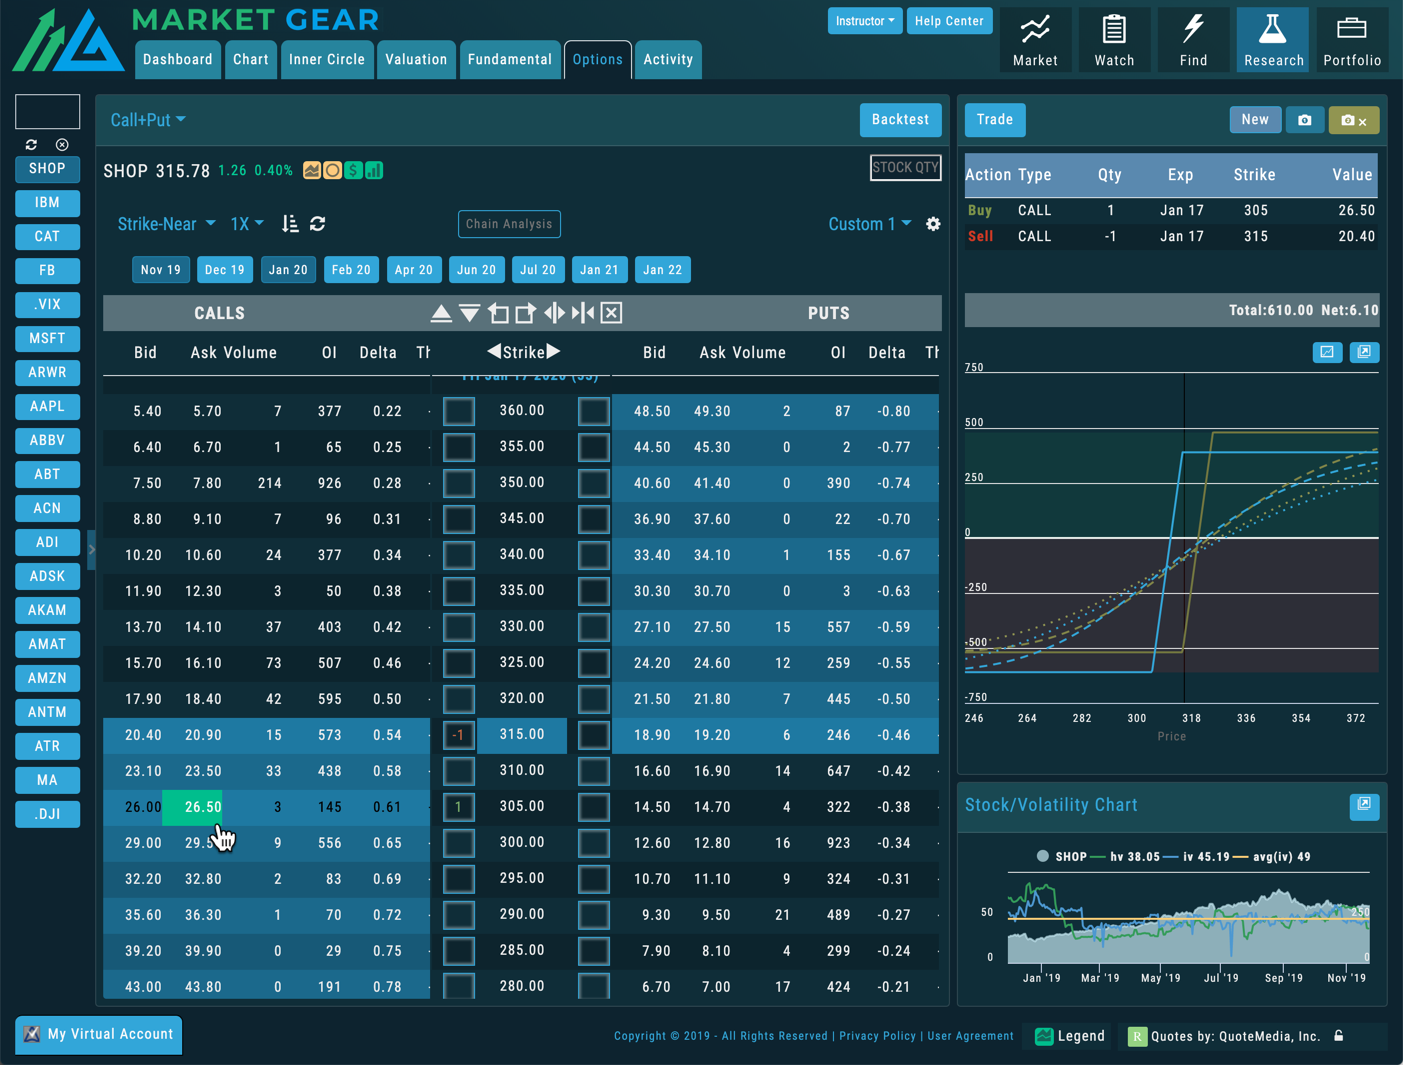
More Than 20 Options Templates
Sort through a variety of templates to stay focused on a single strategy and adjust your strikes or expirations with a simple click to view the different risk/reward parameters.
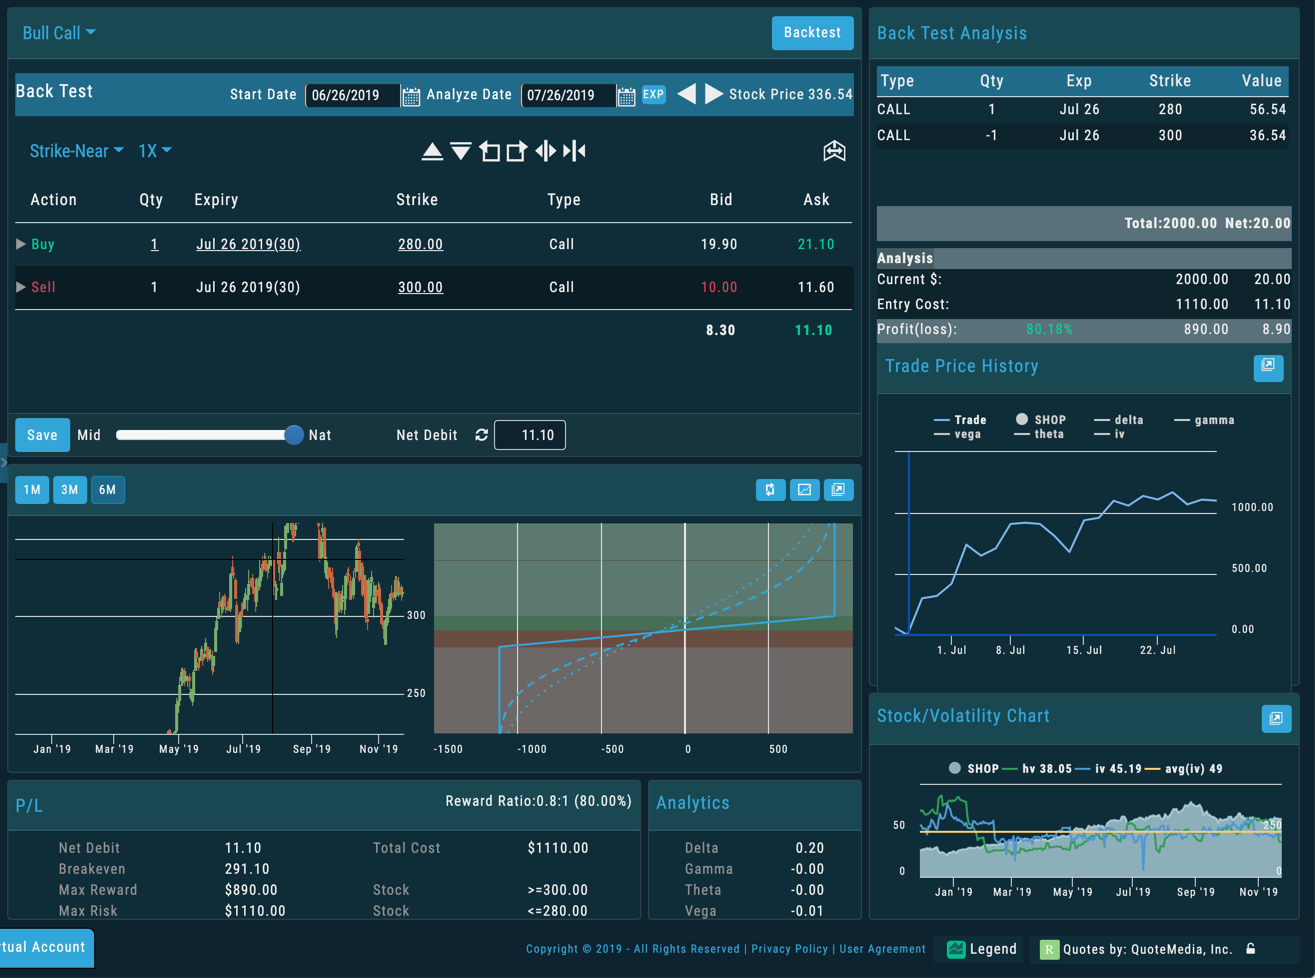
Backtesting for Years
Take your best strategies and backtest them going back nearly two decades with data that allows you to see how a trading strategy would have played out. Put it on the chart to see it visually!
Real-Time Options Scanning
Scan the markets intraday for options pricing that fits your needs. Most platforms can't offer this feature, and those that do charge up to several hundred dollars. It comes with our Master Kit.
Charting
Market Gear Charting Module
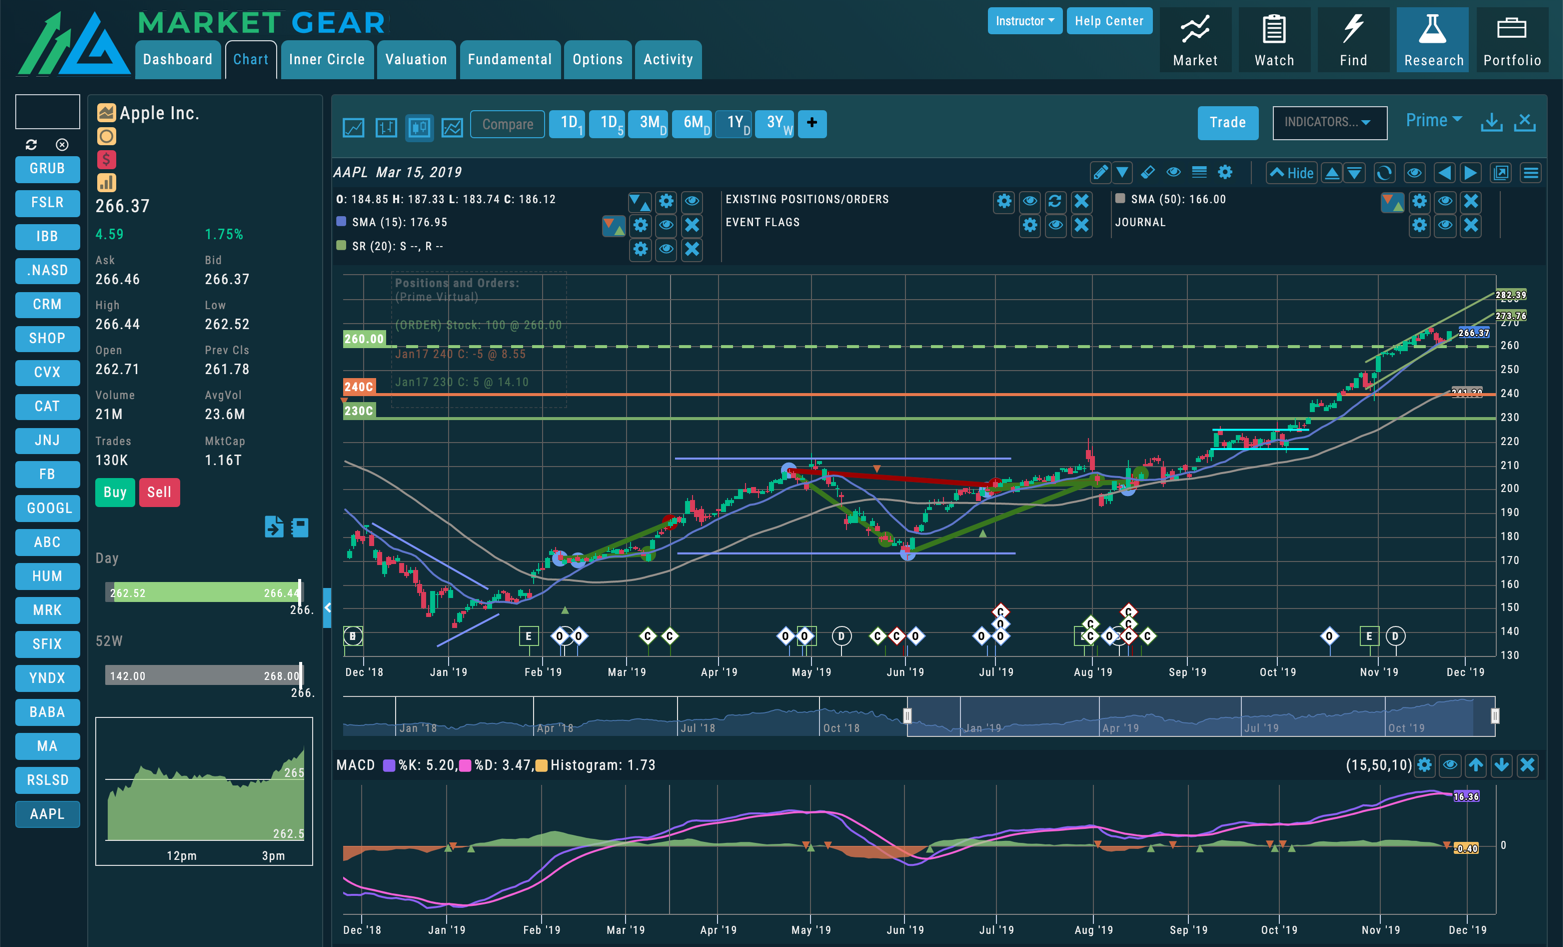
Charting in the Market Gear platform includes the most advanced features in the industry today. You can analyze customizable indicators, view your trades, draw permanent trendlines, review past trades, and more, all from the chart.
Stack Your Favorite Indicators
Choose from over 80 indicators, pick your colors, stack them how you want, and customize every data point to view the market the way that you want to see it.
Dynamic Tools
Draw trendlines that continue to extend as time moves forward, view your cost basis in real-time, and view dozens of indicators not just based on price or Open/High/Low/Close.
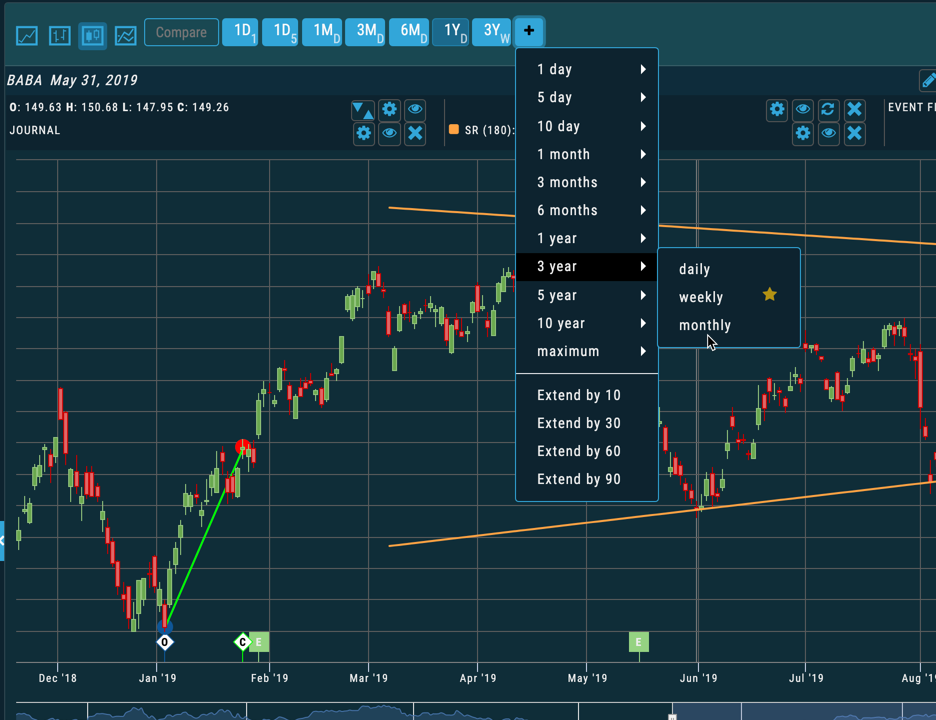
Timeframes for Every Trader
Select from an array of timeframes, starting with a 1-minute chart and going all the way up to a monthly chart. All tools, indicators, and trendlines carry between timeframes.
Zoom and Slide
Quick slide on our timeframe to select how much of the chart you want to see and what date/time range you want to view.
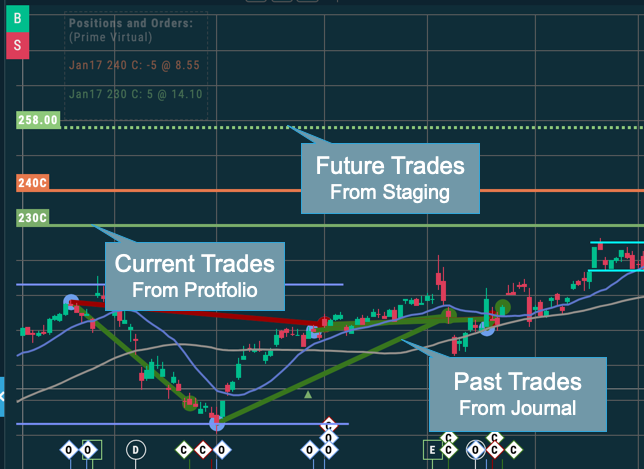
See Your Trades: Past, Present, and Future
Overlay your current trades on the chart, get a glimpse of where a staged trade would put your cost, and review prior trades via the Trade Journal directly on the chart itself.