Market Gear Charting Module
Charting in the Market Gear platform includes the most advanced features in the industry today. You can analyze customizable indicators, view your trades, draw permanent trendlines, review past trades, and more, all from the chart.
Stack Your Favorite Indicators
Choose from over 80 indicators, pick your colors, stack them how you want, and customize every data point to view the market the way that you want to see it.
Dynamic Tools
Draw trendlines that continue to extend as time moves forward, view your cost basis in real-time, and view dozens of indicators not just based on price or Open/High/Low/Close.
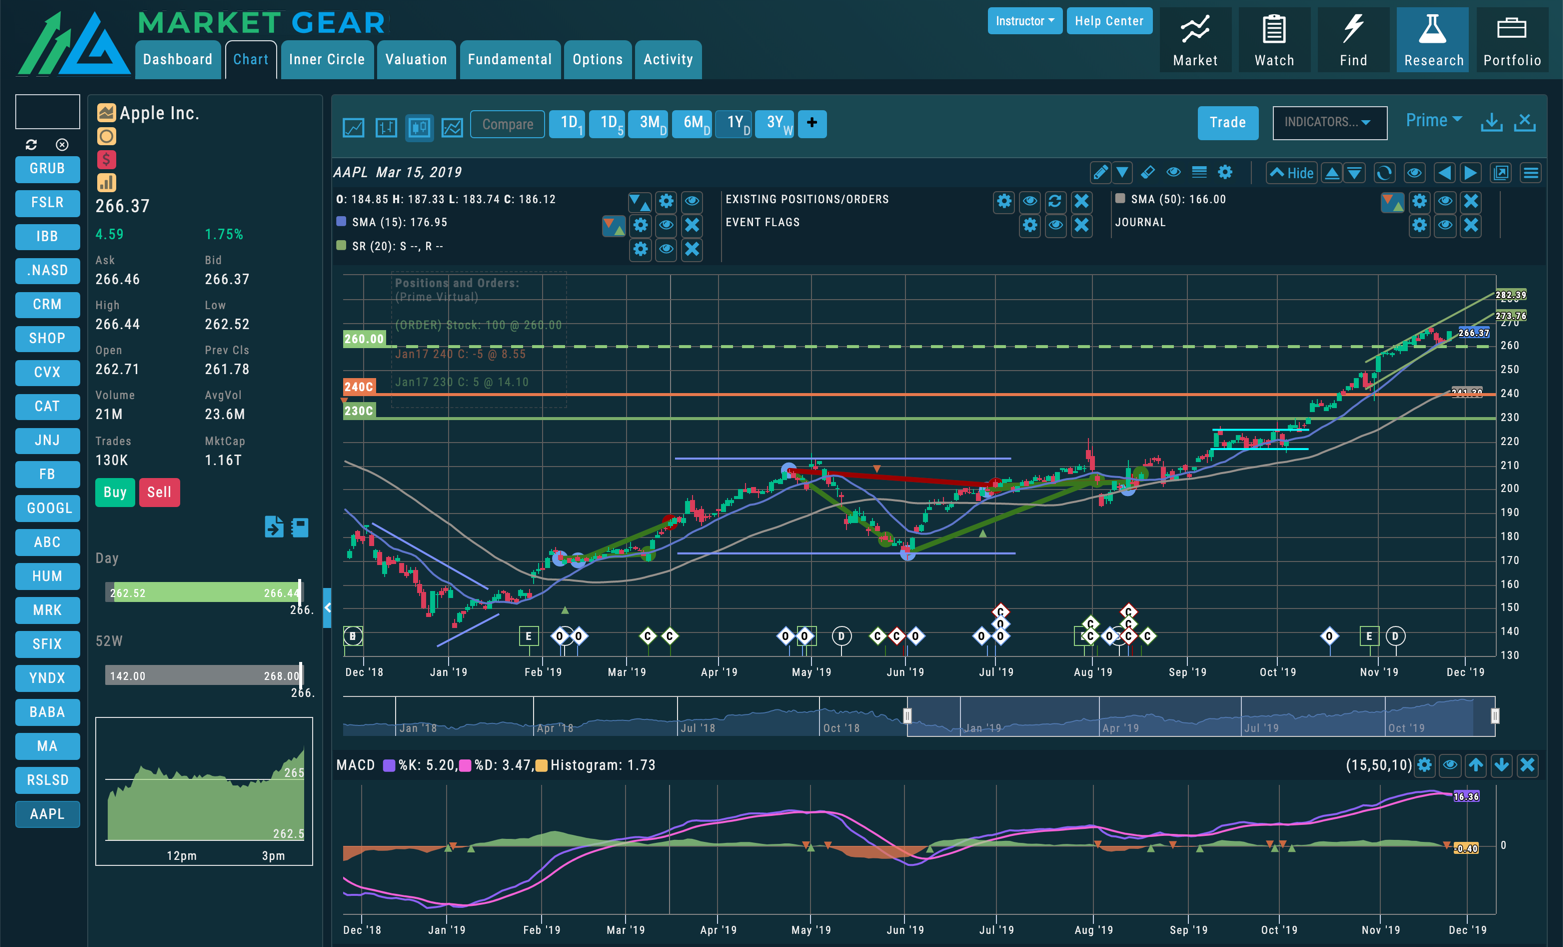
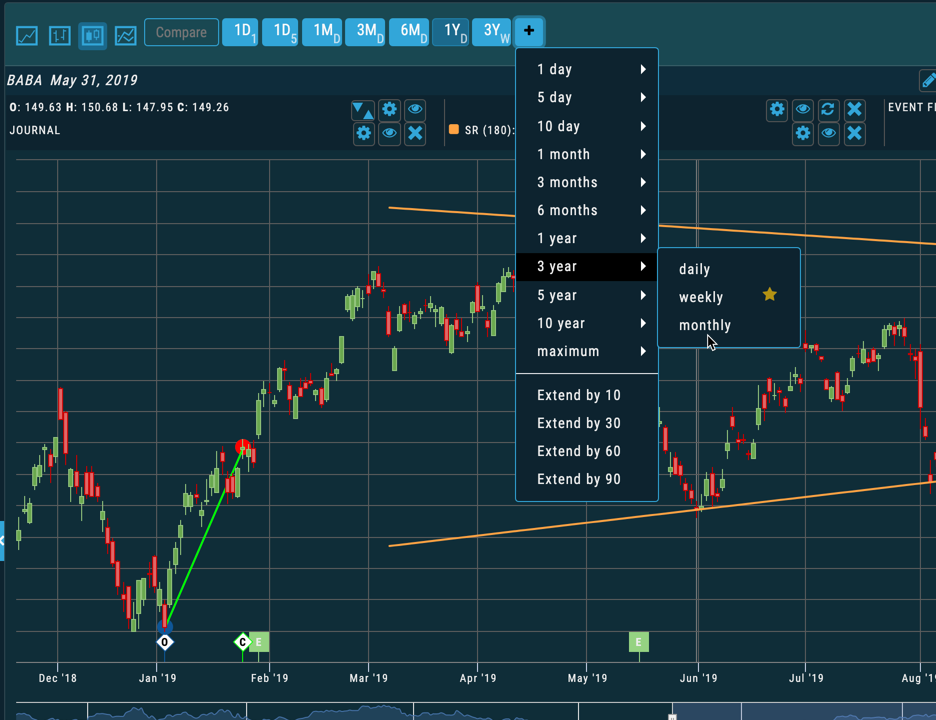
Timeframes for Every Trader
Select from an array of timeframes, starting with a 1-minute chart and going all the way up to a monthly chart. All tools, indicators, and trendlines carry between timeframes.
Zoom and Slide
Quick slide on our timeframe to select how much of the chart you want to see and what date/time range you want to view.
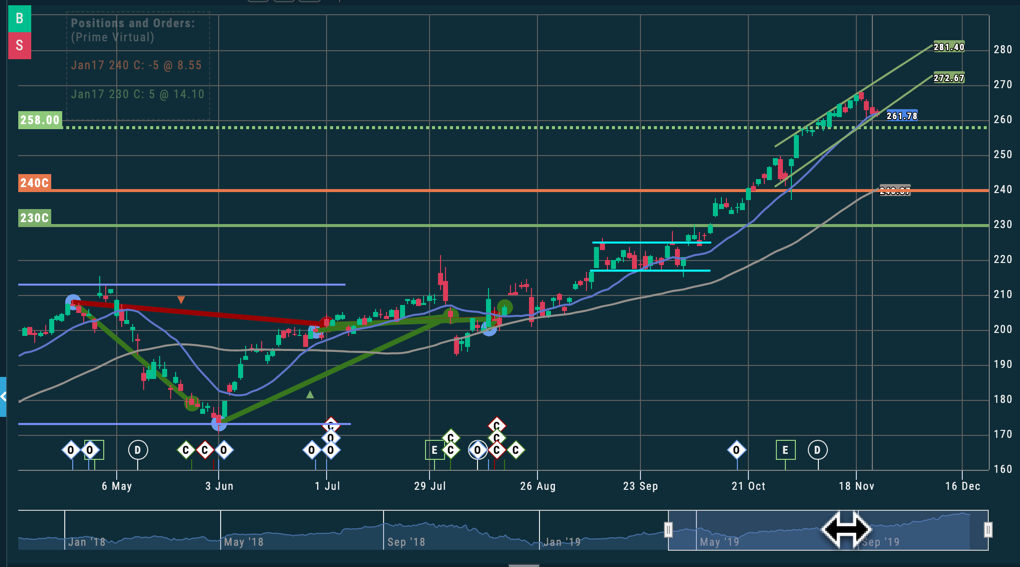
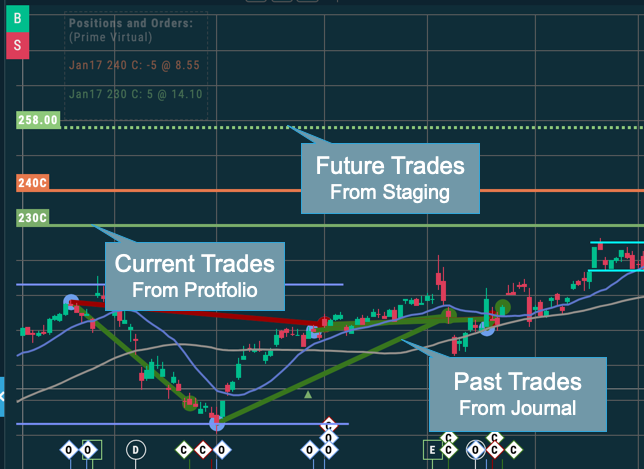
See Your Trades: Past, Present, and Future
Overlay your current trades on the chart, get a glimpse of where a staged trade would put your cost, and review prior trades via the Trade Journal directly on the chart itself.